
Actuarial Statistics Uncovered: Mastering Analytical Techniques
Actuarial Statistics: Fundamental Concepts and Applications
Actuarial statistics is an area of statistics that deals with the analysis and evaluation of risks. It mainly relates to the insurance and financial industries. However, it is now also being used in wider fields, like healthcare, more often as the strength and importance of actuaries and actuarial work becomes more widely recognised. Additionally, the growth and improvements in data science and machine learning mean that traditional methods can now be improved and applied more easily.
Actuarial statistics takes traditional statistical methods, like probability theory and statistical modelling and analysis, and applies these to real world problems to forecast the likelihood of certain events happening. It is then used to assess the financial implications if those events were to occur as well as methods to reduce the possible negative consequences.
Actuarial statistics can be of great importance to both firms and individuals. It allows firms to manage risk and develop insurance policies, while on the other hand, it can be used by individuals to help them plan for retirement by making informed and more tailored financial investments. The main uses of actuarial statistics in the field of Actuarial Science relate to:
- risk assessment
- insurance pricing
- reserving
- pension funding
- financial modelling
Key Concepts of Actuarial Statistics
As actuarial statistics is one of the key parts of actuarial work, the IFoA require you to pass two modules in actuarial statistics in order to become a fully qualified actuary, CS1 and CS2. CS1 is called Actuarial statistics and focuses more on traditional statistics, while CS2 is called Risk Modelling and Survival Analysis and focuses more on the application of actuarial statistics. With actuaries and society in general becoming more dependent on computer software, both modules now also have a computer based assessment in R. The main concepts from the exams and used in the workplace relate to:
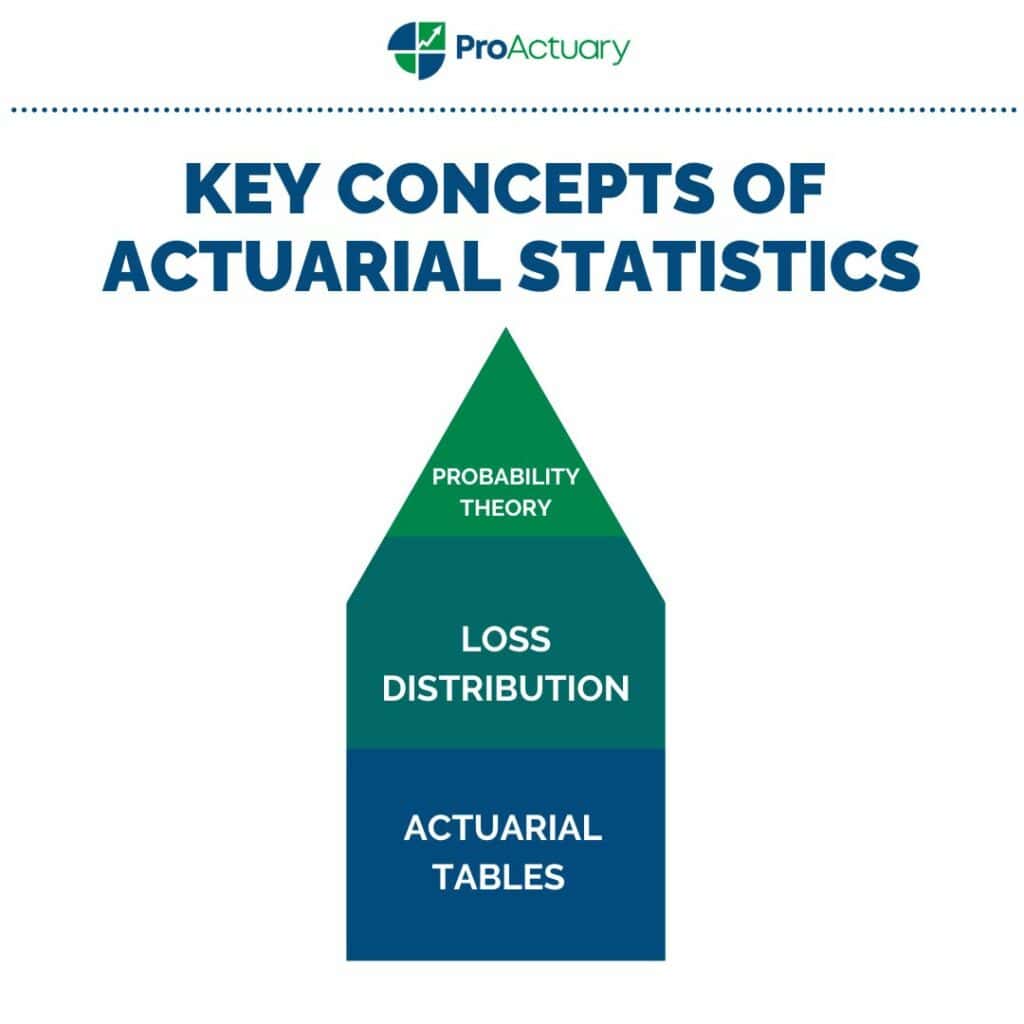
- Probability Theory – This is effectively how likely are the chances of something occurring. Actuaries use probability theory to assess the likelihood of future events so that they can quantify and put a figure on their potential financial impact.
- Loss Distribution – The name sums this up perfectly and it is basically a mathematical function that describes the probability of different levels of losses occurring. Actuaries use statistical models to estimate the frequency and severity of losses. They then use this to come up with a loss distribution so they can set sufficient reserves.
- Actuarial Tables – These are also known as mortality tables and are statistical tools used to predict the life expectancy of a person by their age, gender or other factors. Some insurance and pension companies will produce their own tables but there are also publicly available ones too, like the English Life Tables.
Data Science in Actuarial Statistics: Enhancing Efficiency

Actuaries’ skills are based on analysing data to assess and manipulate outcomes. Data science has many different definitions and uses but put simply it is effectively studying data to extract meaningful insights for businesses. This should mean that actuaries’ skills should go hand in hand with the field of data science.
The significant developments and improvements in technology and software have been recognised by the IFoA and they now offer a certificate in Data Science. It is an online course that can be taken anywhere in the world by all members, regardless of status, and consists of a ten week programme, split between 8 weeks of learning followed by a 2 week assignment. It focuses on introducing a number of different topics, like artificial intelligence, machine learning and data visualisation and communication.
Data science can be used to improve and enhance the traditional actuarial statistical methods in a number of ways:
- Automation – AutoML (Automated Machine Learning) can automate repetitive tasks like pipeline creation and parameter tuning. This leaves actuaries in a position to focus on more important tasks like analysing the models.
- Increased Data Availability – Data can now be collected from new data sources, like social media and wearable technology. These new sources will help provide actuaries with a more holistic view of certain events or trends, allowing them to make better and more informed decisions.
- Improved Predictive Modelling – Machine Learning can improve the accuracy of models by finding patterns in data, identifying outliers, allowing actuaries to make better predictions.
Applications of Actuarial Statistics in Insurance
Actuarial statistics is a critically important tool in the insurance industry. It is used to manage and mitigate financial risk as it provides insurers with the ability to make more informed decisions due to the modelling and analysis that is done.
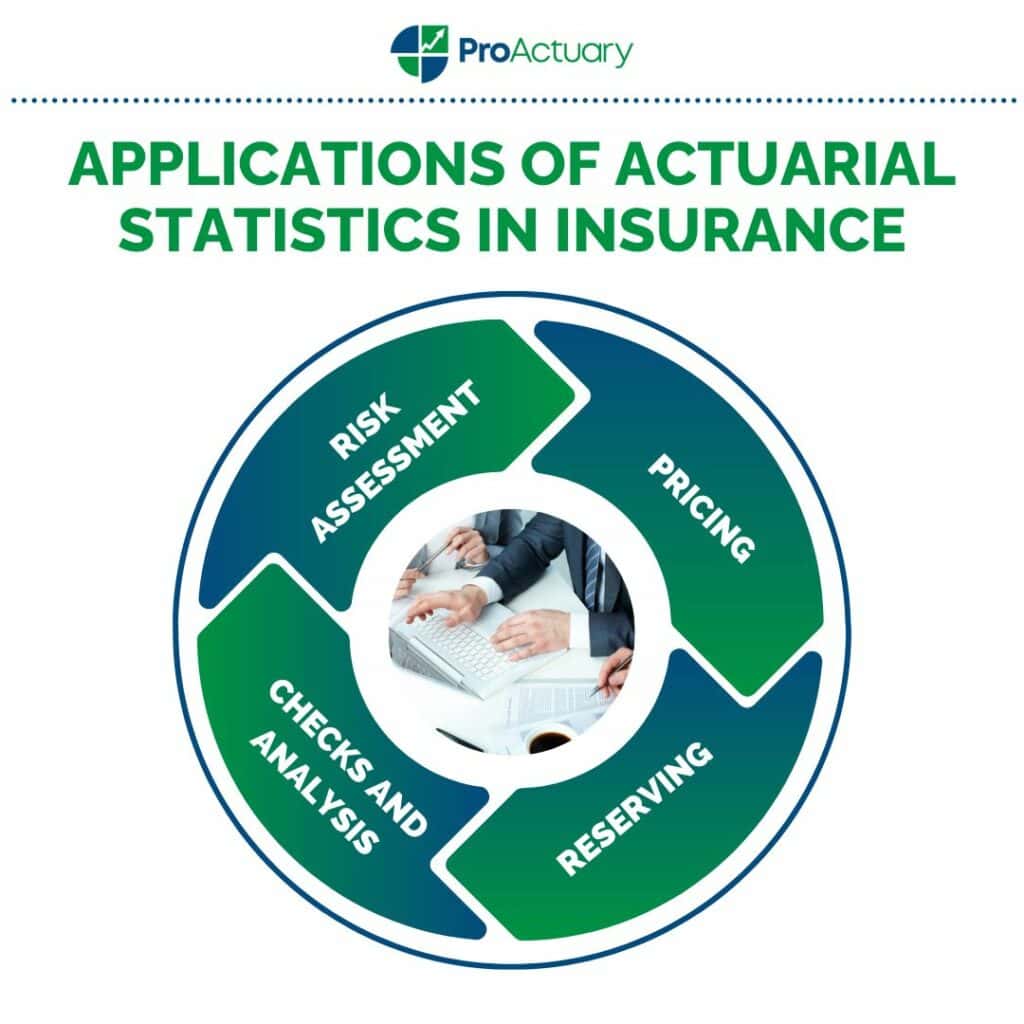
- Risk Assessment – Actuaries use a number of different methods to try and understand risks and assess their potential consequences. They mainly relate to statistical modelling, analysing past events and historical data and considering the views of experts. This then allows them to see what could potentially go wrong. Once they have this they can then come up with strategies and solutions to negate their potential negative impact.
- Pricing – Actuaries use statistical models to determine appropriate insurance premiums to charge. They aim to find a price that will allow the company to be competitive while also ensuring that if they were to have a particularly bad year they wouldn’t make a loss, or too big of one. When building the model they will consider factors like, likelihood of claims, cost of providing coverage and desired profit margin.
- Reserving – As mentioned previously, actuaries use statistical models to estimate losses and then, based on those, come up with a loss distribution. The firm will then use this to set sufficient reserves based on legislation and to fit the company’s risk profile. For example, under Solvency II insurers must maintain enough capital in order to ensure that they have a 99.5% chance of overcoming their worst possible losses in a particular year.
- Claims Analysis, Fraud Detection and Underwriting– Whenever an insurer receives a claim they will run some checks and analysis. This will often happen at two stages. The first is straight after the request for a claim is put in, to check for potential fraud by using statistics to identify unusual past claims patterns or other suspicious activity. The second is done at a later date, on a wider group of claims as a whole, to try and identify any trends or patterns. This information can then be used to come up with new strategies to manage claims more effectively and reduce costs. It can also be used when pricing new policies as they can compare what they expected to happen with what actually happened.
From “The Price is Righter” article by Alistair Black we can see how actuarial statistics and data analytics are being used to improve life insurance pricing.
- Traditionally, pricing relied on lots of monitoring.
- Pricing changes can now be implemented more quickly due to data analytics and better technology.
- Insurers can now model demand and elasticity to become more competitive and increase sales volume.
- They will use data like prices quoted and percentage of quotes converted to sales to measure how effective their current pricing strategies are.
- Actuaries will assess these through Generalised Linear Models, which are easy to explain and understand, and then move on to Machine Learning if they need to further improve predictiveness and competitive advantage, which will provide better models but are harder to develop.
Also, from “Road testing: machine learning and the efficiency of fraud detection” by Pamballi, Ioannou and Parizas we can see how machine learning is being used in general insurance to help detect potential fraud.
- The company sets up a ML pipeline with the aim of spotting fraudulent claims.
- Claims are then assigned a fraud likeliness score.
- Low score – Claim is fast tracked to be paid out.
- Mid score – Further assessment is required.
- High score – Anti fraud action is required.
Actuarial Statistics in Other Fields : Balancing Risks and Returns

Traditionally, actuarial statistics would mainly have just applied to insurance, through projecting mortality, calculating premiums or reserves and analysing historical data or events. However, actuarial statistics is now being applied to many other areas, like finance, healthcare and pensions as the skillset and expertise of actuaries improves over time.
Finance
Actuarial statistics is extremely important and useful in the financial industry as that particular industry deals with a lot of uncertainty. Actuarial statistics can be used to assess risk, through modelling, and assess the likelihood of events happening, through probability theory. These methods allow firms to come up with investment strategies and help them make sure the company will be financially stable in the long term. The main ways in which it is used are:
- Investment management – Actuaries can develop statistical models to develop investment strategies that balance risk and return and perform sensitivity analysis for what if scenarios.
- Lending Risk Assessment – Banks and lenders can also use actuarial statistics to assess credit risk and determine how much they are willing to lend to a borrower and at what rate of interest. They consider certain factors, like income and credit history, to assess the potential risk of the borrower defaulting on the loan and then decide on whether to lend or not.
- Capital Management – Actuarial statistics can be used in capital management in a similar way to how an insurance company uses actuarial statistics to calculate reserves. They will forecast potential losses and then determine how much capital they will need to hold to cover them.
Healthcare
Actuarial statistics can be used in healthcare to improve the quality and affordability of healthcare services through automation, data analysis and predicting patient visiting fluctuations. The main ways in which it is used are:
- Health Insurance Pricing – Used in a similar way to traditional insurance pricing with a premium calculated based on certain factors, like age, health status and location.
- Healthcare Policy Analysis – Actuaries will develop models to assess how effective current methods of healthcare are. They can look at predictions with actuals and compare to see if targets are being met and which areas need improvement.
- Identifying Signs of Public Health Crises – Actuaries can use data analysis to help healthcare providers prepare for population health challenges. This will mean that providers will be in a better position to react to potential health problems and patients will receive a better service.
A real life example of how actuarial statistics and data science is being used in the healthcare industry can be seen from the SoA’s website. The SoA are promoting the ability of their members to make a difference by using data analysis and automation to manage healthcare risk. The healthcare industry generates 30% of the world’s stored data. Actuaries have the ability to use big data and predictive analytics, along with traditional actuarial statistics skills, to provide insights and help healthcare companies manage their needs in a number of ways like:
- Using automation and data analysis to drive more accurate diagnoses.
- Predicting patient visit fluctuations to help control staffing.
Pensions
Actuarial statistics is a very important tool to manage pensions and help participants receive the retirement income they need. It can be used for predicting mortality, reducing uncertainty and investment management which are all very important to pension providers and members, depending on the type of pension. A defined benefit pension promises to pay a certain amount so the provider takes all the risk. However, with a defined contribution pension the company contributes a certain amount each year so the risk is with the member, as the pension is dependent on investment returns. The main ways in which actuarial statistics is used are:
- Funding Requirements – Actuaries use statistical models to determine the amount of money that needs to be set aside each year to fund a pension plan. They consider factors like age, expected lifespan and predicted investment returns.
- Risk Management – Actuarial statistics can also be used to try and manage the financial risks associated with pensions. Sensitivity analysis can be performed on investment returns, interest rates and retirement ages to see what potential implications changes could have on the pension the member receives.
- Compliance – Pensions plans must comply with legal and regulatory requirements. For example, under the recently introduced Pension Schemes Act 2021 defined benefit pension schemes must now have a funding level of 1:1. For every £1 of liabilities, the scheme must hold £1 of assets. Actuaries can build statistical models to plan for the future to reduce the risk of assets falling below liabilities. Therefore, they can reduce the risk of any legal action potentially being needed to be taken against the company as the scheme should be adequately funded.
From the article “UK companies could be overstating pension liabilities by £60bn” by Chris Seekings we can see that XPS Pensions, using a combination of traditional actuarial methods and modern data science techniques to consider a full range of potential scenarios, were able to see they were overestimating liabilities:
- Life expectancy lower due to COVID-19.
- Won’t have to pay benefits for as long so should save money.
- Built stochastic models using traditional actuarial statistics methods along with data science techniques.
- Can assess the impact on mortality as well as changes in financial assumptions.
Concluding Overview: Key Insights in Actuarial Statistics
To conclude, the main points from this article are as follows:
- Actuarial statistics is an area of statistics that deals with the analysis and evaluation of risks.
- It takes traditional statistical methods and applies them to real world problems.
- It is one of the key components of actuarial work, highlighted by the weighting put on it through the actuarial exams.
- It is vitally important that actuaries take advantage of their skills by using data science so that they improve their productivity and decision making.
- Data science should be used to compliment actuarial statistics rather than replace it.
- Actuarial statistics is mainly used in insurance through risk assessment, pricing, reserving and claims analysis but can also be applied in other areas, like finance, healthcare and pensions.
Actuarial Statistics FAQs
“Fergal Goan graduated from Queen’s University Belfast in 2023 with a BSc degree in Actuarial Science and Risk Management. You can connect with him on LinkedIn.”