The Decline in Actuarial Exam Pass Rates and Potential Impacts on Student Travel Time
Introduction: Actuarial Exam Pass Rates
UK Actuarial Exam Pass Rates have declined in some actuarial Core subjects over recent years. In this article I present the data showing the decline, as well as the possible implications on travel time to actuarial qualification.
Scope of Analysis
In this article I am only considering the Core actuarial exams. Specialist actuarial exams have a smaller number of attempts each sitting, which makes it more difficult to determine true trends. I have also not included CP2 and CP3 as irregular actuarial exam dates meant this was harder to analyse.
In this article I define the ‘new’ era as the exams on or after April 2019. This was the last major curriculum change and was when the current exams were first implemented. The ‘old’ actuarial exams have been mapped to the ‘new’ era exams for comparison purposes. For ‘double’ exams CM1 (compared to CT1 and CT5) and CS2 (compared to CT4 and CT6) I have taken an even-weighted mean of the ‘old’ era actuarial exams to represent each sitting.
I am an already qualified UK actuary and have no vested interest in actuarial exam pass rates being increased. I have tried to be as objective as I can in this article.
Trends in Historical Actuarial Exam Pass Rates
Firstly, we consider the exams CB1, CB2 and CP1 in Figure 1. The points in the graph below shows the pass rate for each sitting. To help observe trends, I have plotted a 5-point rolling median with the window being ±2 sittings from the point plotted.
In each of these actuarial exams, pass rates have been fairly stable over time. It could be argued that CP1 has fallen slightly, however there are no startling movements.
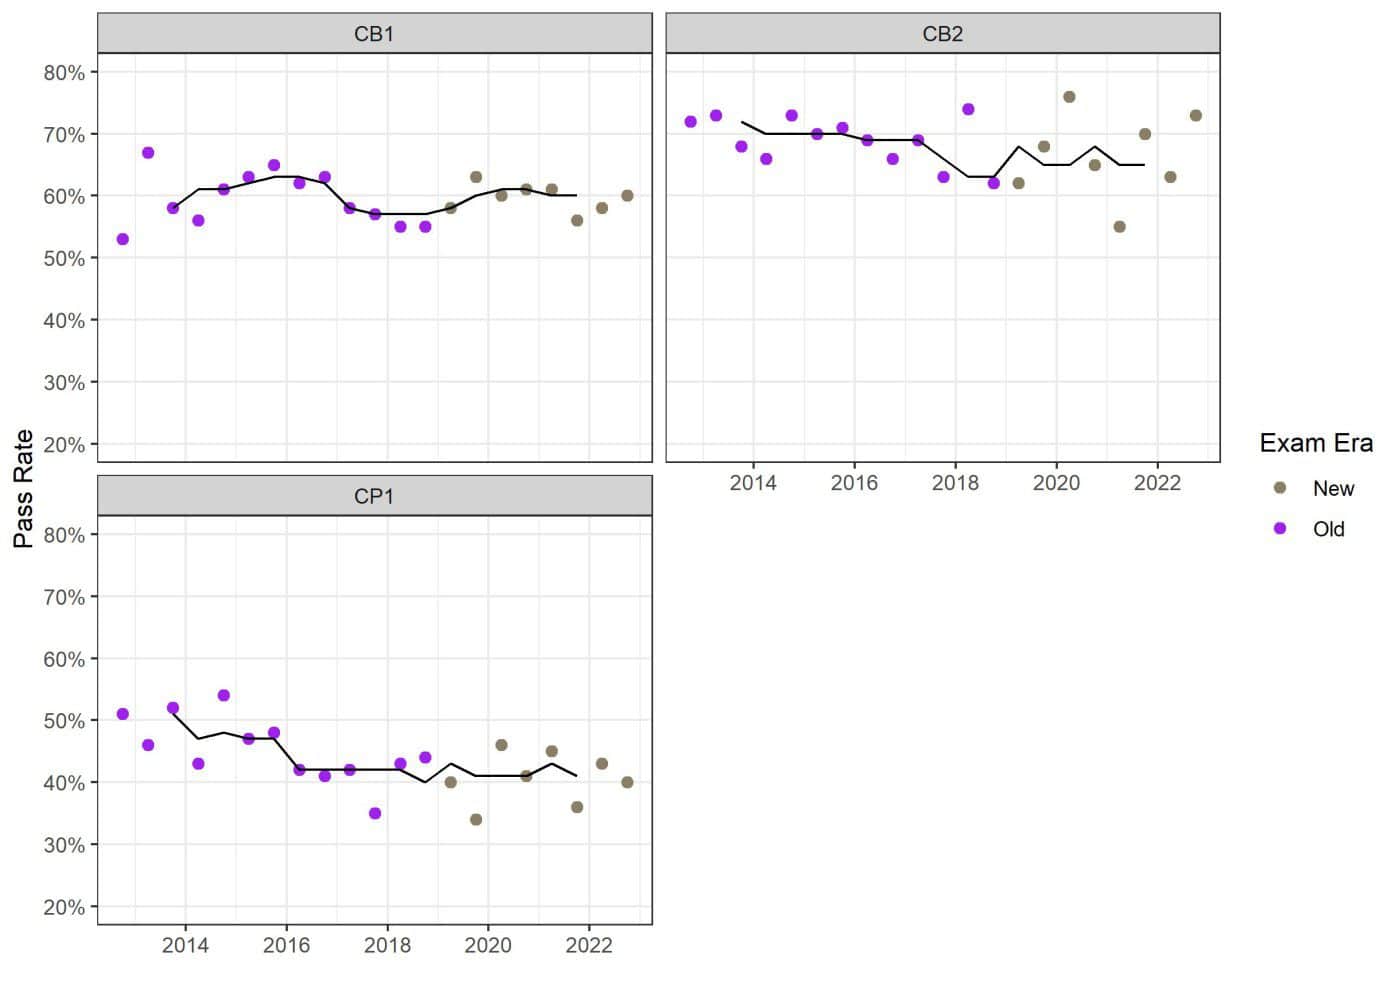
Figure 1: Historical actuarial exam pass rates for CB1, CB2, CP1
Now we move on to CM1, CM2, CS1 and CS2. Here we see a completely different story. Each one of the actuarial exams has seen a material fall in median pass rate, typically in the region of 15-20%. Interestingly, the fall seems to happen at a slightly different date for each exam, however they all occur between 2018 and 2021.
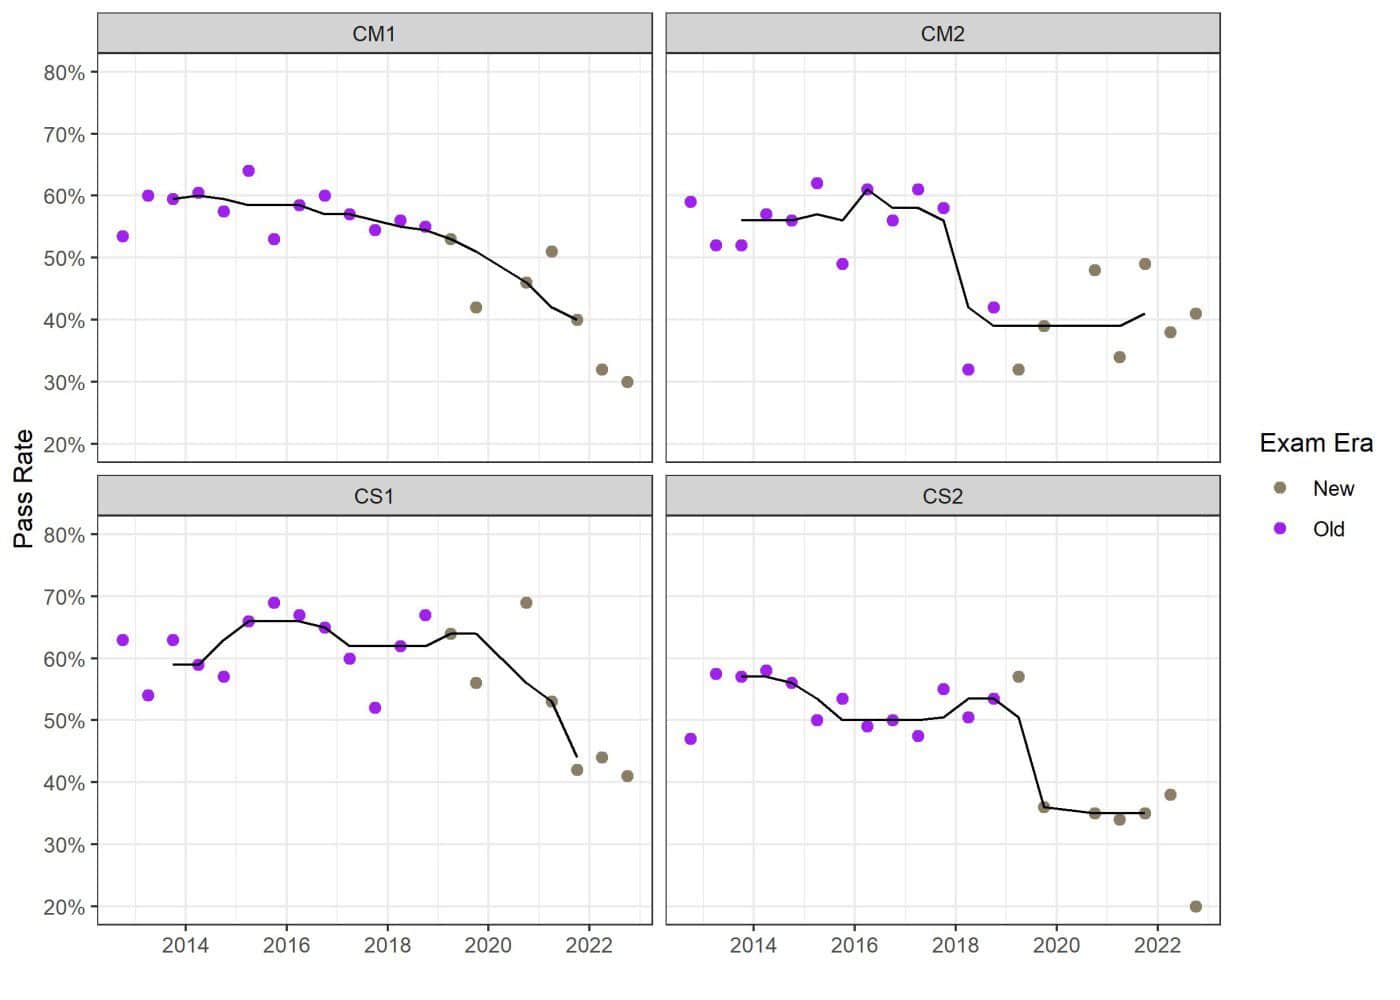
Figure 2: Historical actuarial exam pass rates for CM1, CM2, CS1, CS2
The reason for the fall in actuarial exam pass rate is not knowable from this data alone. However, I do believe it is a genuine trend and not random noise. It is possible that the decline is due to a more difficult exam process. It is also a possibility that a decline in candidate quality explains the trend. There are some notable changes that occurred around the decline period. These are:
It is worth noting that the four exams which show a material decline also happen to be four of the exams that had a serious curriculum change. Both CB1/CT2 and CB2/CT7, which had less change applied to the syllabus, also showed little change in pass rate over the same period.
When we look at the mean actuarial exam pass rates of the two eras we see a similar story. These are shown in the plot below, with the size of each bubble proportional to the recommended study hours for each exam.
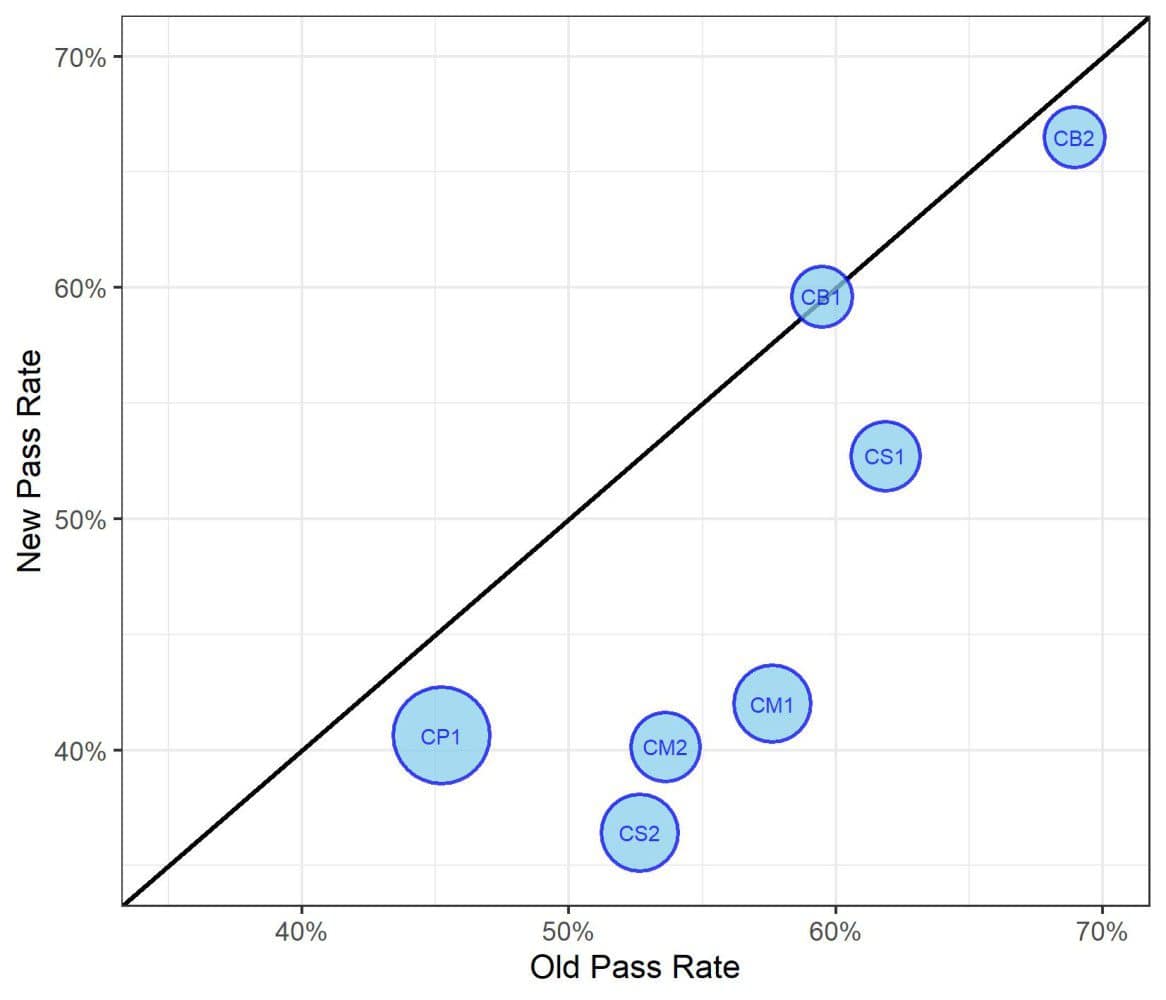
Figure 3: Mean pass rates of ‘new’ era versus ‘old’ era
Student Quality vs Exam Difficulty
As mentioned above, a decline in actuarial exam pass rates could be interpreted as an increase in actuarial exam difficulty, or a decrease in actuarial student quality. Without good data it cannot be determined which of these reasons explains the trend.
If actuarial student quality has declined in recent years, it could be environmental such as the impact of Covid-19. It could also be due to a change in the mix of students. It is worth noting that the number of actuarial students has started to increase in recent years. A flooding of the actuarial exams with low quality students could explain some or all of the decline. However it is also worth noting the decline has not occurred in all Core actuarial exams, which we might expect if general student quality was the issue.
In the analysis below on travel time, I assume actuarial student quality is the same. That is to say a typical actuarial student in the ‘new’ era is as talented and well-prepared as an actuarial student in the ‘old’ era.
Theoretical Impact on Travel Times
How does all of this impact the journey an actuarial student goes on to qualify as a Associate Actuary or Fellow Actuary? Can we translate these actuarial exam pass rates to travel time? I consider this in the following purely theoretical thought experiment.
The geometric distribution models the number of failed Bernoulli trials before achieving a success. We could model the number of attempts sat by a student for each exam using this distribution. Note this distribution assumes, perhaps unreasonably, that the pass rate for students performing in each of the first, second, third, fourth (etc) attempt pools is the same.
The pool of students on their first sitting could be argued as better performing overall as they will contain the higher performing students who rarely find themselves in the resit pool. On the other hand, actuarial students in the resit pools will have had more time to prepare and should have developed more experience. This could offset the effect of the ‘elites’ in the first attempt pool and so perhaps it isn’t the most unreasonable assumption.
I have set the number of attempts on each actuarial exam using a geometric distribution. The probability parameter is set as the mean actuarial exam pass rate for that exam and era (these are shown in Figure 3).
The outcome for number of attempts on each exam is almost certainly correlated for each student. A student who has passed 5 actuarial exams without fail is more likely to pass their 6th on first attempt than a student with a less impressive record. To incorporate this I have constructed a Gaussian copula and trialled different inter-exam correlations. Without any data, there is no way to calibrate this correlation matrix. The correlation values used are therefore purely demonstrative.
Finally, not all exams are equal in size. Actuarial students can also take different options in their exam journey which are too diffuse to model. To collapse the results into something more interpretable, I have done the following:
- To weight the exams, I have multiplied each attempt by the number of study hours recommended by the IFoA for that particular exam. The number of hours for first sitting and resitting are the same, so for example 3 attempts to pass CP1 would be counted as 1,200 hours.
- Each simulated student will end up with a total no. of study hours based on all their attempts. This total no. of study hours is then converted to a travel time in years. To do this, I have assumed it is reasonable for a student to pass all Core exams first time in the space of 2 years (I have observed this kind of pace in a consultancy environment, perhaps 2.5 years would be more appropriate outside of that). Given this totals to 1,600 hours of study (for both ‘new’ and ‘old’ era) we are equating 400 hours of study to 1 half-year of travel time.
- As travel time is discrete in practice, I have rounded it upwards to the nearest half-year period.
In the plots below, the distributions of actuarial exam travel times are shown. An increase in correlation skews the distribution, and causes the proportion of students passing in the minimum time (set as 2 years) to increase. Note the tails of the distributions go far beyond 6 years, however it has been cut off to focus on the dominant travel times.
Firstly, we show the travel times for the ‘old’ actuarial exams.
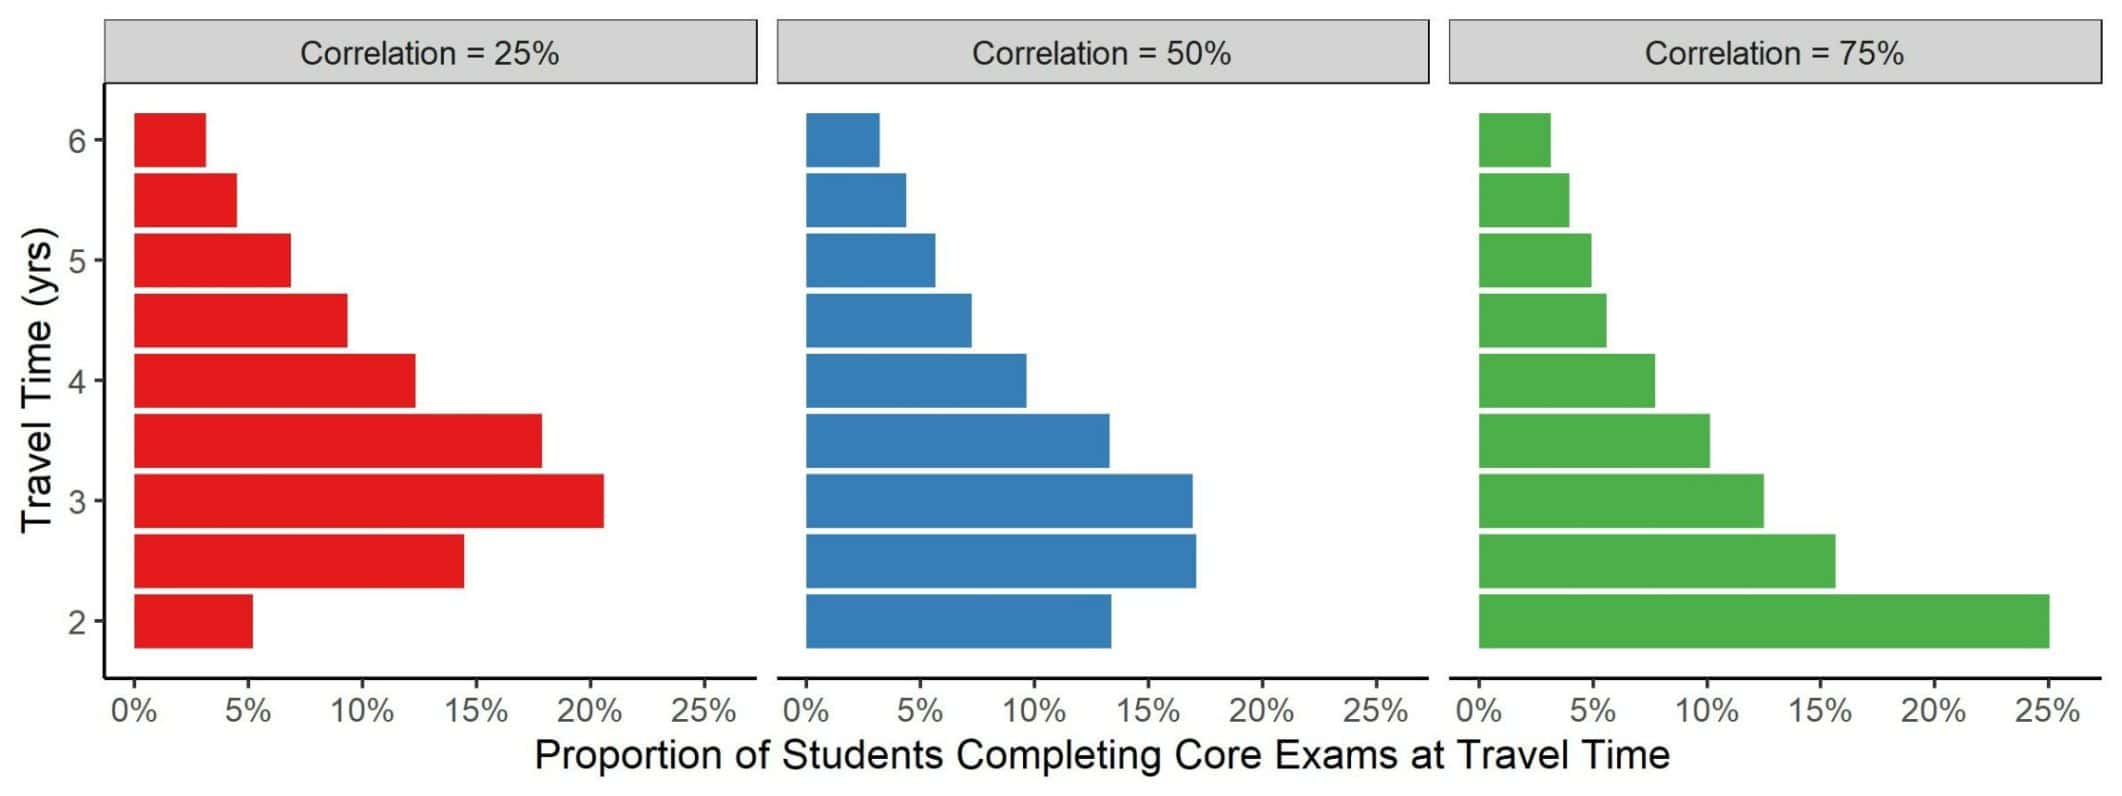
Figure 4: Theoretical distributions of travel times to complete ‘old’ Core actuarial exams, when minimum time is 2 years
Secondly, we show the travel times for the ‘new’ actuarial exams.
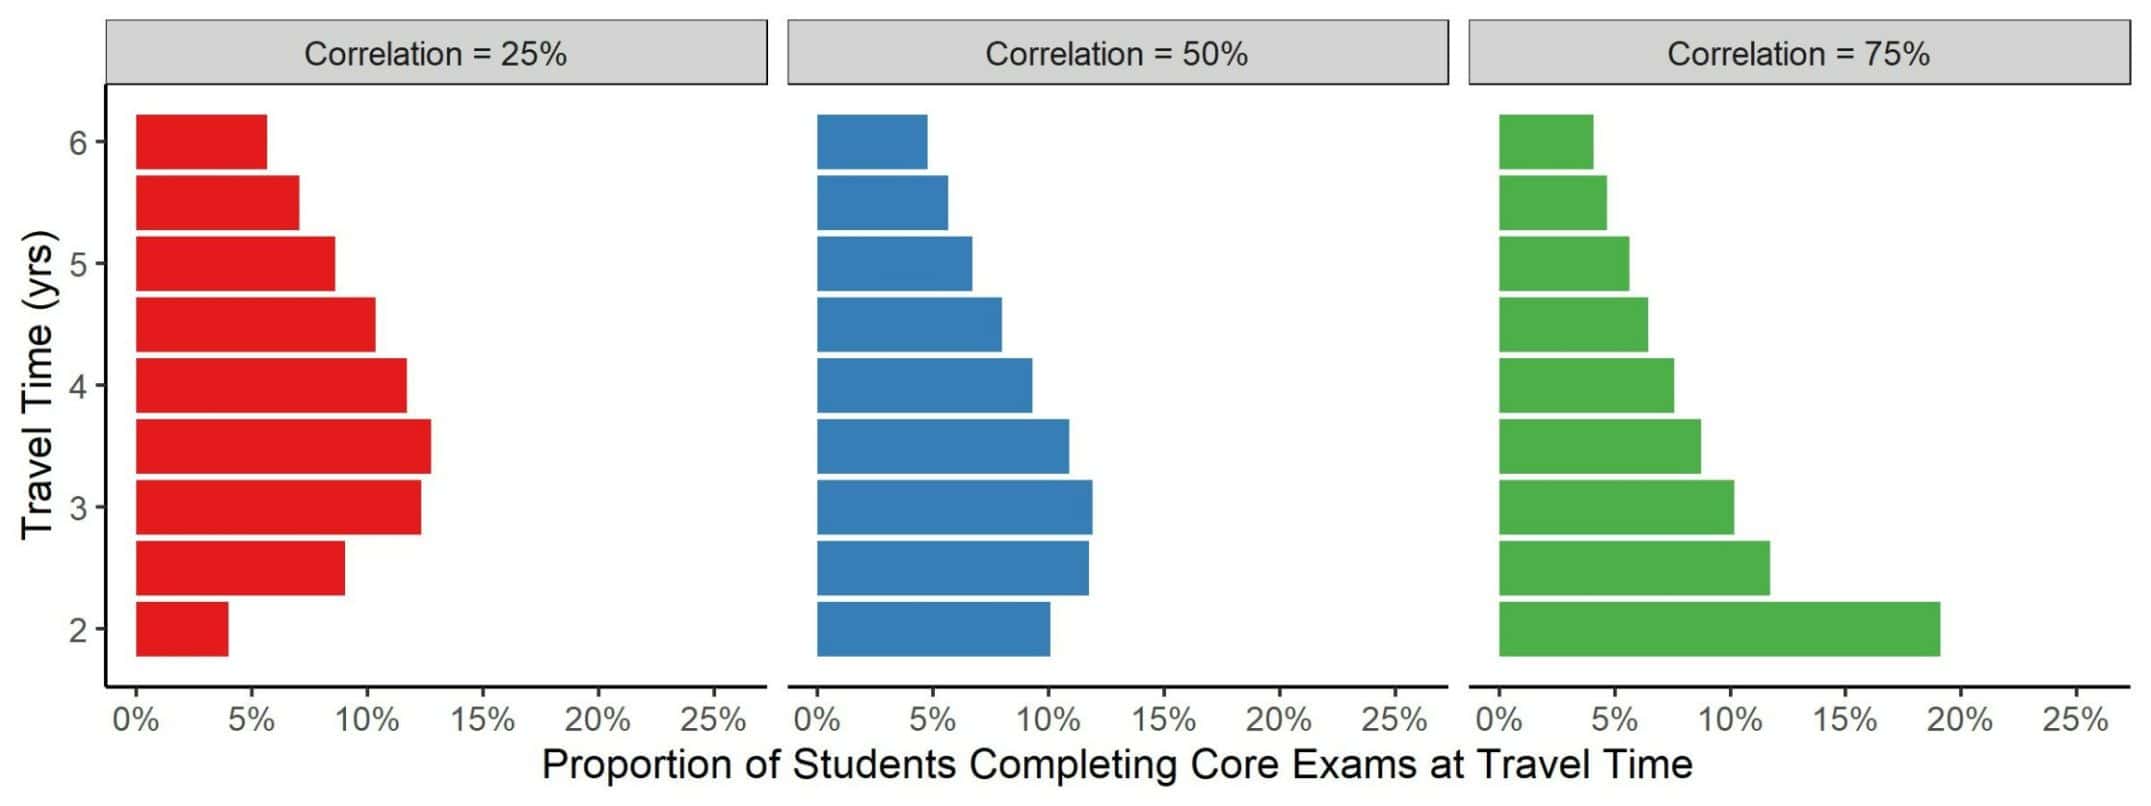
Figure 5: Theoretical distributions of travel times to complete ‘new’ Core exams, when minimum time is 2 years
For the shorter travel times, the proportions are always lower in ‘new’ era than ‘old’ era. This is an expected result given the lower actuarial exam pass rates. The density is spread through longer travel times, some of which are beyond the range of the plot.
Finally, we compare the travel time of ‘old’ actuarial students versus ‘new’ actuarial students at equivalent percentiles of their distributions. Unlike the previous plots, I have not rounded the travel time to the nearest half-year. This allows a continuous distribution that is easier to observe the pattern.
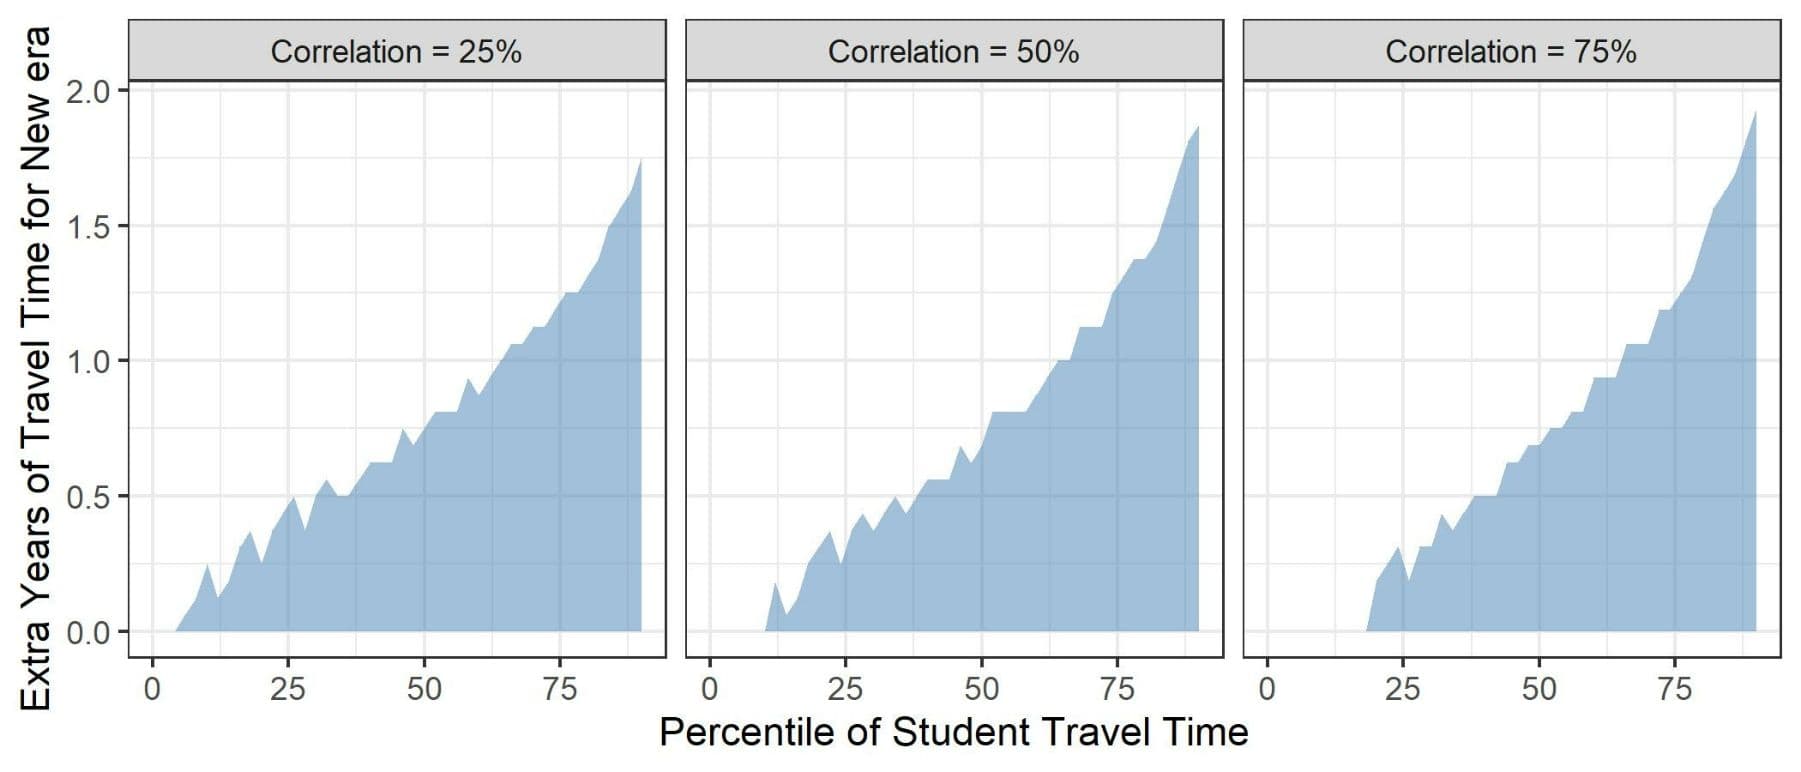
Figure 6: Theoretical increase in study time required in ‘new’ era compared to equivalent percentile of student in ‘old’ era
The plot shows not all actuarial students are impacted equally. There are still a material proportion of actuarial students who will pass all actuarial exams first time, and have no extra travel time added. As we move down the rankings for students, the gap widens. If we look at the median student, the travel time has increased by a similar amount for all correlation assumptions, which is in the region of 0.75 years. This could be thought of as an extra 1-2 full actuarial exam sittings. When we go even further down the distribution, the impact is even more severe, with the lower quartile actuarial student expecting roughly an extra 1.25 years of exams, or 2-3 full actuarial exam sittings.
Much like price inflation barely touches the wealthiest whilst severely impacting the poorest, the inflation of difficulty in actuarial exams doesn’t touch the highest performing students, but increasingly lengthens travel time going down the distribution.
If we assume the median student in the ‘new’ era is as competent, prepared and skilled as the median student in the ‘old’ era, then the typical student will face a longer journey on their route to qualification as an actuary. Perhaps by a full year.
Concluding Thoughts on Actuarial Exam Pass Rates
The actuarial exam pass rates of CM1, CM2, CS1 and CS2 exams have seen a clear decline. This occurred in the region of 2018-2021. CP1 also shows a slight decline. Both CB1 and CB2 seem to have been unaffected.
A thought experiment around travel times suggests the median student may now expect to take 1-2 extra sittings to complete their Core exams, though it is acknowledged there are many limitations within this analysis.

Paul Beard, FIA
“Paul Beard, FIA is an Actuary at Phoenix Group. Prior to that he was an Actuary at Royal London. Paul graduated from University of Cambridge in 2011 with an MS degree in Natural Sciences. You can connect with him on LinkedIn.”


