
Actuarial Data Overview: The Foundation of Actuarial Science
Introduction to Actuarial Data: Understanding Its Core Importance
Explore the transformative role of actuarial data in shaping business strategies, where rigorous data analysis merges with modern technological advances, driving the actuarial profession into new realms of efficiency and accuracy.
We live in a data driven world, from the price we pay in the supermarket for essentials, to the advertising content we are exposed to on our social media platforms, data’s influence is far reaching and affects our daily lives in more ways than we might think.
Take, for example, everyone’s favourite conversation starter, the weather. Open any weather forecast, and you’ll often be greeted by a convenient dashboard outlying such projections as temperatures, wind speeds and chances of precipitation for the days ahead, allowing us to plan our week accordingly. Is tomorrow’s forecast giving clear skies and temperatures of 30 degrees? I can probably leave my coat at home. Gale force winds and thunderstorms? Probably best to postpone that BBQ.
Obviously, such forecasts are not merely the result of random guessing, but instead rely on terabytes of data obtained from thousands of weather stations across the globe which meteorologists use in forecasting computational models to eventually present the data in a readily accessible and understandable format.
Indeed, many of the concepts covered under the umbrella of ‘data science’ are directly applicable to the actuarial profession. As we will discuss later, actuaries typically obtain data from credible sources, use the data to perform analysis, attempt to model future outcomes and then present the results to meet the needs of the end user. But before we can get stuck into the modelling process, the first question we need to ask is, what data are we using and where does it come from?
The First Steps in Actuarial Data Analysis
Data analysis is not a ‘one size fits all’ concept, data comes in many different shapes, sizes, and structures. Qualitative data describes the object in question and can be defined as;
- Nominal – Where there is no ‘ranking’ of the data, for example, occupation or country of birth.
- Ordinal – Data which has a natural ordering, such as clothing sizes (i.e., large > medium)
Data which can be quantified numerically is described as quantitative data and can be classed as;
- Discrete – Numerical values which can be defined by integers (i.e., claim numbers)
- Continuous – Numerical values which can take any value (i.e., claim amounts)

As we traverse the vast jungle of data it’s important to remember that no matter how sophisticated or advanced our modelling techniques are it will be rendered completely redundant if the data we use is of a poor quality, or just simply irrelevant to the task at hand.
Computer scientists often use the term GIGO, referring to ‘garbage in, garbage out’, the concept that the quality of our output is only as good as the quality of our input, a poor decision of data source can not only undermine the entire analytical process but may lead to reputational, legal and financial damage for the responsible party. A sticky road that can be avoiding by considering the sources of data available and selecting the best one for the task at hand.
When choosing between data sources, an actuary may wish to use company data, which will be specific to company operations and could therefore be more detailed in relation to the company’s activities. An actuary may also look to branch out and consider industry data, which provides a broader overview of the industry in general whilst also allowing for comparisons between similar companies. Branching out further again, government data which provides a broad view of various industries across various geographic regions could also be considered.
Once you have decided upon a data source it’s time to start modelling! Actuaries have been applying modelling techniques for centuries and in the next section we discuss how such techniques have evolved and what the future holds for actuaries.
The Evolution of Actuarial Data Process
Since the first life tables were constructed by John Graunt back in the 17th century, actuaries have strived to find patterns and draw conclusions from data sources at their disposal.
With the expansive volume of data available to actuaries, manually performing calculations by hand would not only be a drain on time, but also opens the door to mistakes by human error. Big data (collections of extremely large dataset), for example, could feature thousands or even millions of data points, to even attempt and work with data of such a vast magnitude would be a futile endeavour without some form of computerised assistance.
Thankfully the modern actuarial arsenal is fully loaded with a range of software and programs. Spreadsheet software such as Excel allows us to analyse and store data whilst more advanced calculations and modelling techniques can be performed on statistical programming software such as R or SAS, even programming languages such as Python are now becoming more and more essential as actuaries look to build more efficient and well-defined models than ever before.
We can consider 5 steps to the data science process;
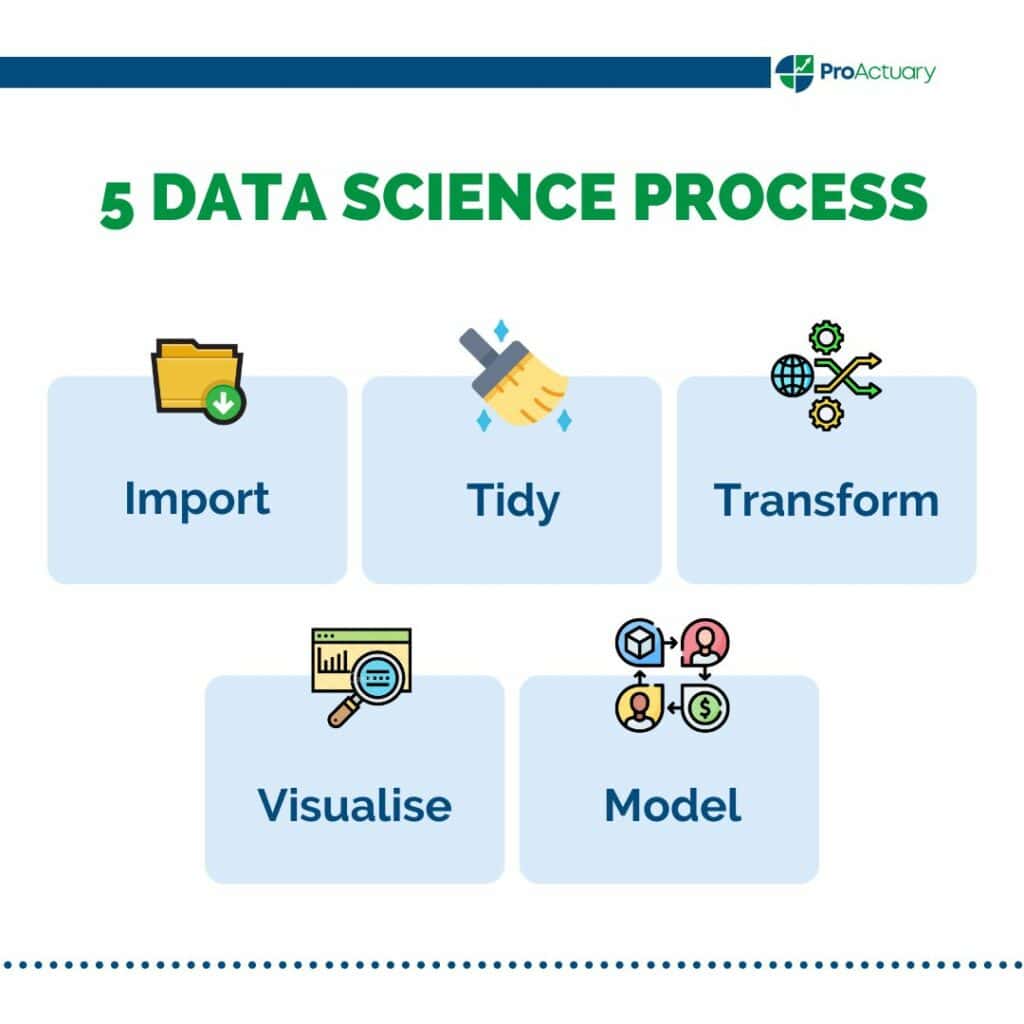
- Import – Can you import your data into the software you wish to use?
- Tidy – Is the data formatted in a consistent manner? Is the data easy to manipulate and analyse?
- Transform – What are the observations of interest? Can we create new variables form the existing data?
- Visualise – What can we learn from visualising data? Can graphical analysis provide useful insights?
- Model – What can we conclude from the results of our modelling process?
An actuary with a strong knowledge of data science will flourish when presented with analytical problems and will be able to use the steps above to define the intervals for which the analysis takes place (i.e., an auto insurance company wishing to investigate likelihood of claims with age), to draw conclusions from visualisations of the data (i.e., graphs showing number of auto insurance claims by age) and use statistical techniques to produce a model from which predictions of future events can be made (i.e. using regression techniques to identify potential risk factors affecting claims and claim amounts for policy holders of a certain age).
So, now we have an output from our model, what next? What can we conclude from our results? To quote statistician George Box, “All models are wrong, some are useful”. Inaccuracies in models are not only common but expected. No model will ever be a perfect representation of the task it is simulating, nor should you expect it to be. Models may make assumptions for the sake of simplicity whilst maintaining a required degree of accuracy. The question you are asking is not ‘Can I hit the bullseye of 100% accuracy’? But instead ask yourself;
- Do are results lie within an expected range?
- What are the best- and worst-case scenarios?
- Do the assumptions we make hold true?
What can we do to check the accuracy of our model? Actuaries will often monitor the experience, meaning they will typically check the projected results of the model with the actual realised results that occur as time passes. Earlier we mentioned GIGO and whilst this is applicable to modelling techniques, the reverse (garbage out being a result of garbage in) should not always be taken as gospel, yes there will be occasions when outliers in results are due to poor quality of the initial data set, but an actuary most also consider the following;
- Model selection – Is the model chosen the most appropriate for the task at hand?
- Assumptions – Do the underlying assumptions simplify the problem to a degree where inaccuracies occur?
- Extreme events – Is there an extreme external factor that the model did not account for?
Now that you’ve successfully created a model the time has come to communicate the results. Let’s go back to our weather forecast example from earlier. I’m not a meteorologist, yet I’m able to interpret within seconds what the forecasted conditions for the next few days will be. The complex modelling techniques underlying the forecast are beyond the scope of the general public and yet the results been condensed in such a way that is accessible and easily understood by all who use them.
Actuaries often suffer under the stereotype that they are maths geeks who spend their weekends locked away studying the intricacies of mortality tables, but the need for strong communications skills is as prevalent as any other industry. When communicating the results of a model, actuaries must be aware of who the audience is. Bombarding those from a non-actuarial background with a presentation loaded with complex descriptions of the methodology behind a model will merely lead to widespread confusion with the key message getting lost in the fog of technical jargon, whilst an over simplified report given to a head of actuarial functions will reflect poorly on your perceived knowledge on a subject.
What actuaries are capable of today in comparison to even 10 years ago is extraordinary. The software at our fingertips allows us to perform calculations and analyse results faster and with a higher degree of accuracy than ever before. What’s next? Let me introduce you to artificial intelligence…
The Impact of AI on Actuarial Data and Analysis

Let’s go back to 1997. A chess match is taking place in Manhattan. In one corner, is Gary Kasparov, 6-time chess world champion and widely considered to be one of, if not the greatest chess players of all time. In the other corner was IBM’s ‘Deep Blue’ chess computer. And so, in the 19th move of the deciding match of a 6-game series, Deep Blue moved its pawn to c4 and Kasporov resigned. In that single moment, history was made. Artificial Intelligence had taken on the best humanity had to offer and triumphed, but this was only the beginning.
Fast forward to today and even in the world of chess, AI and machine learning has advanced rapidly, with Deep Blue paling in comparison to the might of modern chess engines such as DeepMind’s AlphaZero. These systems have advanced by playing themselves at chess millions of times using deep reinforcement learning to improve by recognising winning patterns, an example of machine learning.
Of course, the impact of AI and machine learning span well beyond the confines of the 8×8 chess board and we are undoubtedly living amid an AI revolution. Look no further than ChatGPT, a language model, which has propelled the capabilities of AI into the mainstream due to its ability to understand prompts and respond with a scarily high degree of accuracy.
So how has machine learning affected the actuarial profession? We see actuaries using machine learning in the following ways.
- Supervised learning – Models such as regression analysis where a response variable is estimated via input variables obtained from historical data.
- Unsupervised learning – Cluster analysis enables segmentation of data that does not have a predefined label.
- Reinforcement learning – A model which does not rely on historical data but instead compares a predicted response to an actual outcome to improve the next iteration of the model, this can be seen in Markov Decision-Processes
Even from an insurance perspective, consider wearable technology, which provide us with health metrics we didn’t even know existed, could this data be collected and used to influence health insurance premium calculations? What about the inevitable day that driverless cars enter the market? How will the auto insurance industry assess claims made by AI error? These are all key questions we must ask ourselves as we aim to adapt to this ever changing, rapidly evolving AI world and whilst we have every right to embrace these changes, we must also beware of the inherent dangers that inevitably coincide.
Actuarial Data in the Age of Cyberthreats: The Role of Data Science

When considering how we use data we must also keep in mind the human element behind the data we receive, particularly from an actuarial perspective. Behind every insurance claim, for example, there is an actual person who has been impacted in an actual way and it’s important to be aware of laws and regulations surrounding the protection of such data.
Where there is data there is opportunity for criminal elements to take advantage. Theft of personal or financial information can have dire consequences and it is paramount that when managing large datasets, steps are taken to ensure that secure and confidential information is not illegally passed on to third parties.
In 2019 nearly 900 million sensitive documents were left exposed due to insurance company First American Financials’ failure to adequately protect against the threat of cyberattacks. But this is just one example of a larger problem faced by those who handle data. Much like AI systems are becoming more advanced, so are those wishing to exploit data systems for their own personal gain. It is for these reasons that caution must be taken when handling data.
Education yourself regarding the importance of maintaining client confidentiality, adherence to GDPR laws and the warning signs of cyberattacks may appear to be a mundane task, but as the saying goes ‘an ounce of prevention is better than a ton of cure’. It’s better to take appropriate steps to prevent any risk of cyberattack than plummet down the potentially catastrophic rabbit hole of legal and reputational damage that could follow in the worst-case scenario.
Conclusion: Synthesizing Key Insights in Actuarial Data

With the world of data science rapidly changing day after day in the advent of artificial intelligence, we must ask ourselves, are we ready to meet the challenges that come with it face on? Keeping up with modern data analytical techniques is not only something I would recommend but is paramount to any aspiring actuary. Fail to adapt to the advancements in machine learn and you can very easily find yourself left behind but rise to the challenges and the potential of what can be achieved are limitless.
Whether you love it or hate it, data science is unavoidable, and we should cherish the resources at our disposal when compared to what those in the profession who came before us had. Artificial intelligence won’t kill actuarial science, it will propel it to new heights, previously thought to be unimaginable.
This is an exciting time to be an actuary, so the question is, are you ready to join in the data science revolution?
Actuarial Data FAQs

John Doherty
“John Doherty is a Trainee Actuary at SS&C Technologies. Prior to that he was an Actuarial Intern at CACI Dublin (Credit Agricole Creditor Insurance). John graduated from Queen’s University Belfast in 2023 with a BSc degree in Actuarial Science. You can connect with him on LinkedIn.”